
Oracle EPM Reporting: How to Build a Trailing 12-Month (TTM) View

Building a report that shows the previous 12 months sounds simple enough, but it gets tricky when working with separate Year and Period dimensions. Can you build a report that shows datasets that bridge years, and can you make it dynamic? Do you need to build the logic in your application, or should you build this in a SmartView template in Excel? While different use cases require different solutions, in this article, we will cover a simple report design hack that addresses the most common requirements.
Out-of-the-Box Dimensionality in Oracle EPM
In most Oracle EPM implementations, out-of-the-box (OOB) capabilities and pre-built assets are enabled with separate dimensions for Year and Period. Separating these dimensions provides flexibility for modeling and analysis, most notably with planning/budgeting and consolidations.
Exceptions to this include:
i) FreeForm applications allow for custom-built models without the need for separate Year and Period dimensions. As the application is customized, there are a number of OOB features that cannot be enabled, including Predictive Planning.
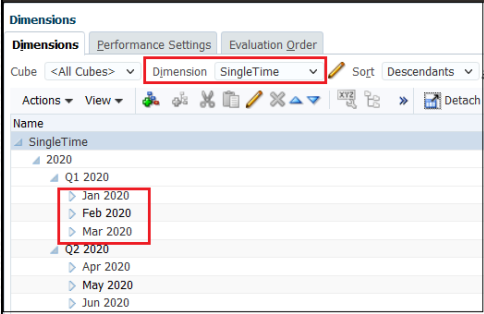
ii) Financial Consolidation and Close (FCCS) now allows for the creation of a “virtual” single time dimension, which will simplify building views that cross years.
The application will still have separate Period and Year dimensions, but a new dimension called “SingleTime” can be leveraged in data forms and SmartView. (Note: Use of the SingleTime dimension is not supported in reporting – FR or MR – as of December 2022.)
The Challenge with Relative Functions Across Years
What about creating a TTM view when you must consider two time dimensions – Year and Period? For example, if a user selects Jul 2022, the report should show data from Aug 2021 through Jul 2022.
![]()
If the user selects Dec 2022, the report should show data from Jan 2022 through Dec 2022.
![]()
How do we build a report that knows when to display periods from 2021 and 2022, like in the example above, but is not hardcoded? Just like with other “trend” report types, these reports can be built using the RelativeMember function when combined with some advanced conditional suppression.
The Report Design “Hack”
There are essentially five components to the report design. We will walk through the selections with the first example we discussed, in which a user selects Jul 2022 and would like to see data from Aug 2021 through Jul 2022.
![]()
- The first column is set up to show data from the prior year in the case when the trailing periods overlap years (e.g. Aug 2021 to Dec 2021). The selection is Relative to Current Point of View for Years offset by -1.
- In the same column, we set up the Period selection to be a Range from Relative to Current Point of View for Period offset by 1 to Dec. So, when the user selects Jul, the column will show Aug to Dec.
- In the second column, we set up the Years dimension to show the Current Point of View for Years. This will show the dataset for 2022 in our example.
- For the Period dimension in the current year column, we select Range from Jan to Current Point of View for Period. This will show data from Jan to Jul.
Now we have the base data set, but what if the user selects Dec 2022, as in our second example? The report will show Jan to Dec 2021 in the first column (because the period offset of +1 from Dec in component 2 is Jan), and Jan to Dec 2022 in the second, which is incorrect.
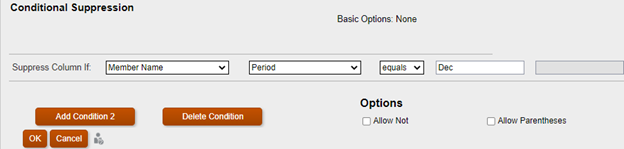
To address this, we need to add a column to help suppress the prior year’s data when the user selects Dec.
- This is a hidden column, and it is used as a condition in the advanced suppression setup for the first column. There are two steps here; the first is to set up this column as Hide Always, and the second is to set up Conditional Suppression logic to suppress the column if the period is Dec:
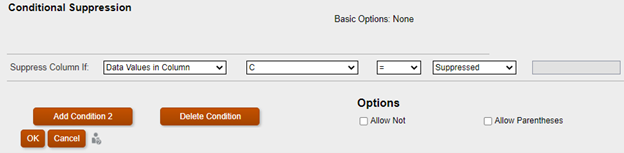
Then, for the first column, you will set up Conditional Suppression if the hidden column is suppressed:
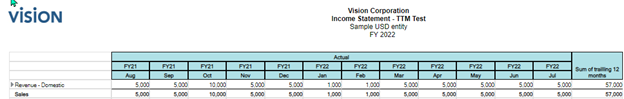
You now have a dynamic trailing 12-month report! You can apply the same concepts for a trailing 6- or 18-month report, as well, to support rolling forecasts and other trend reports. In the example below, we’ve also added a sum so you can present a trailing 12-month total.
Contact us with any questions. Thanks for reading!
About AST
AST is an award-winning, full-service enterprise solution provider, guiding digital transformation for clients in the Government and Commercial Sectors for more than two decades. Clients look to AST for leadership and assistance in transforming their organizations via software solutions, process engineering, and change management.
About Oracle
Oracle (NYSE: ORCL) is a publicly traded multinational computer technology provider selling database software and technology, cloud-engineered systems, and enterprise software products. It offers integrated suites of applications plus secure, autonomous infrastructure in the Oracle Cloud.
Leave a Reply