So, what exactly is embedded content? Well, it all starts with the common report content that’s created by those reference doclet authors and kept in a reference doclet. This content then becomes available for other doclet authors to use.

Now in the past, when we embedded a report into the report package, note and text boxes were nowhere to be found. It was a bit of a hassle to make those notes and text boxes available in the report package.

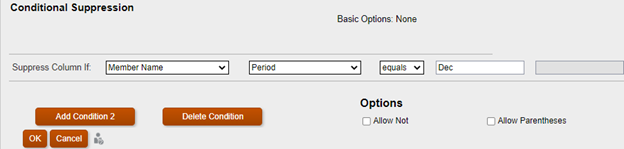
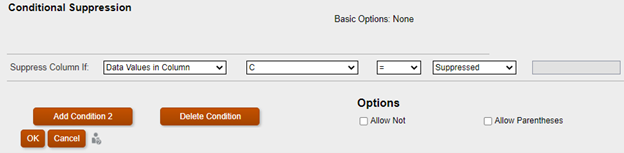
With the new and improved Report Reference doclets, any Text or Note boxes in the Report can be designated as available content. This means that regular doclet authors can now easily include Text and Note boxes in their reports, just like they would with grids and charts.

Financial reporting is a big deal for most companies. You’ve got your internal reports for things like board packages, management updates, or quarterly updates. And then you’ve got external reports, like statutory, regulatory, filing, or annual reports. No matter what kind of report it is, the important part is gathering accurate information, double-checking it for accuracy, and presenting it in a way that makes sense for businesses.

How it works:

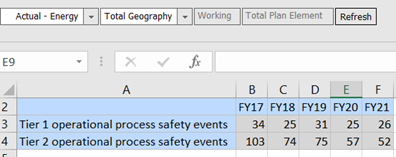
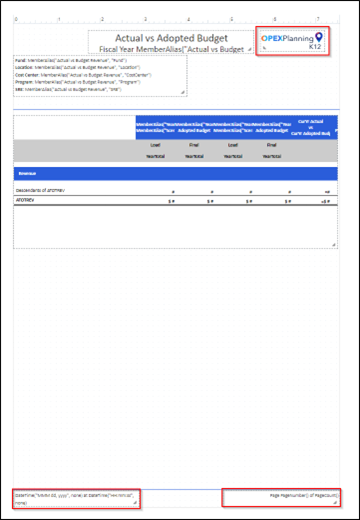
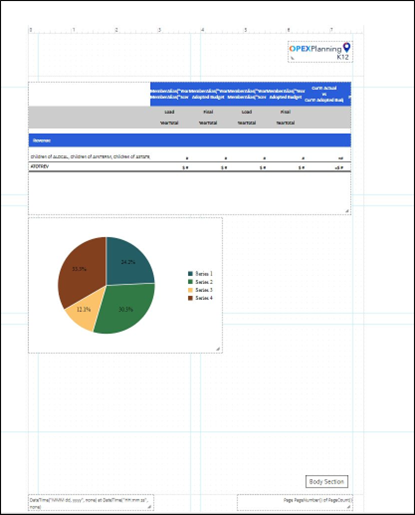
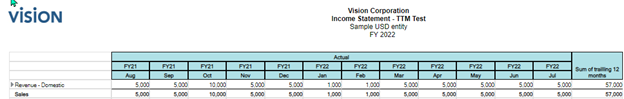
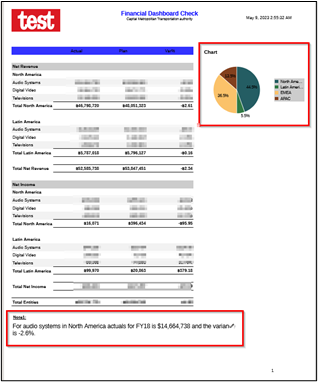
Here’s a report that has logos in the header and footer text, which adds a nice touch. And that’s not all – it’s packed with all sorts of elements like grids, charts, notes, and text boxes.

Now, we’re going to embed this awesome report into the report package. But, before we do that, we’ll make sure to include a grid, chart, and some notes in the package as well.

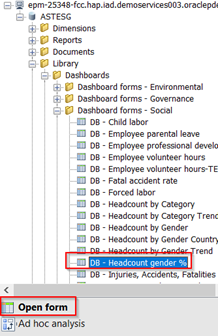
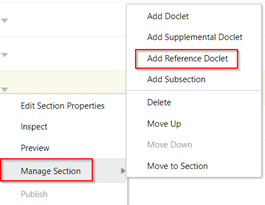
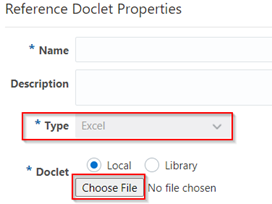
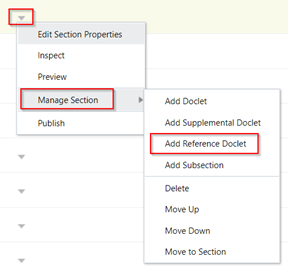
Oh, and one more thing! We’ll add this report as a reference doclet in the report package. That way, it’ll be easily accessible and can be used as a point of reference for other reports.

So, get ready to jazz up that report package with this fantastic report and make it even more informative and visually appealing!


Reference doclet authors upload and check in reference doclets, thus making the report content available to doclet authors.

Here is the link for your reference:

About Embedded Content from Reference Doclets

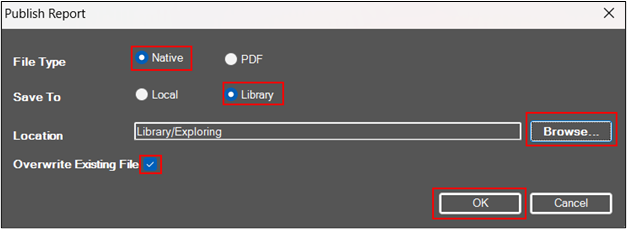
Add the note box to the report package and make it available:

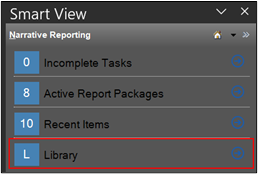
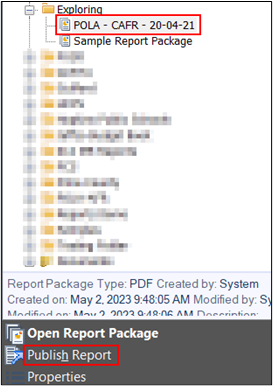
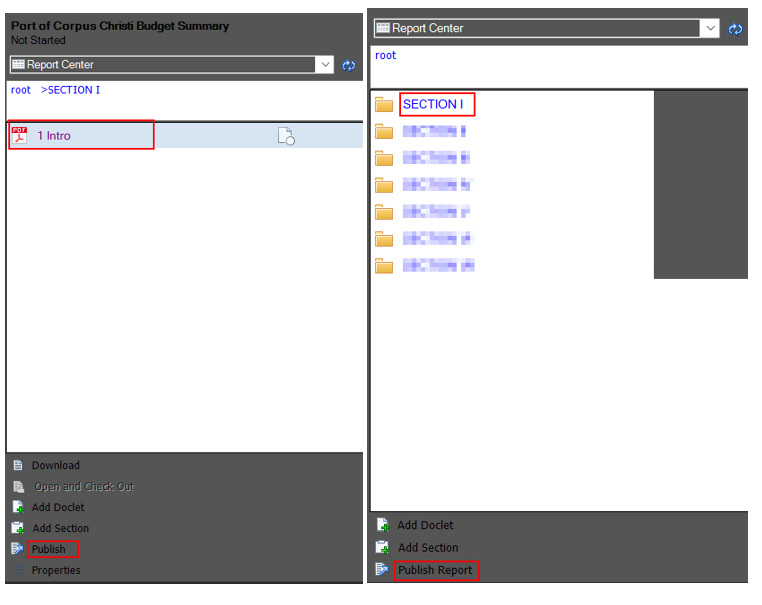
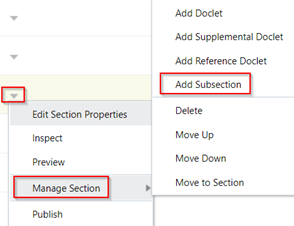
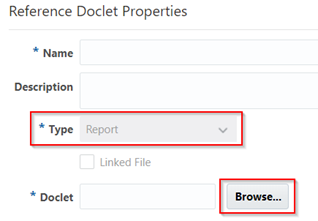
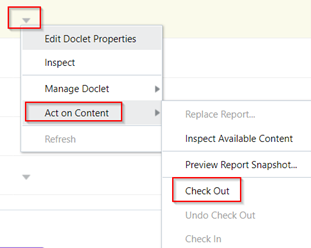
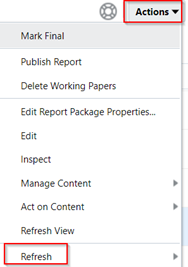
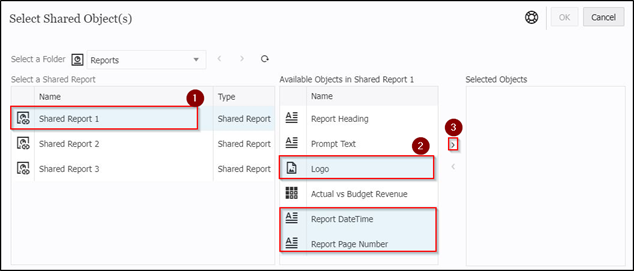
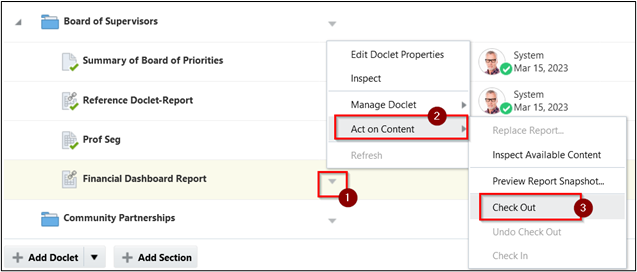
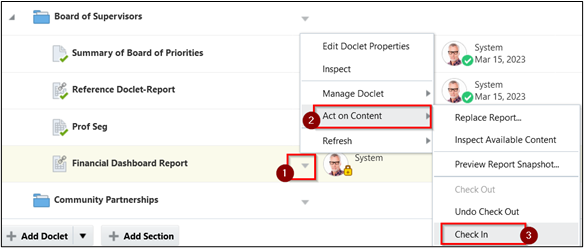
1. Select the report which was been added as a reference doclet.

2. Click on the “ down arrow,” which is next to the selected report.

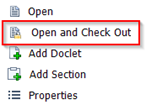
3. Click on “Act on Content” > Check Out


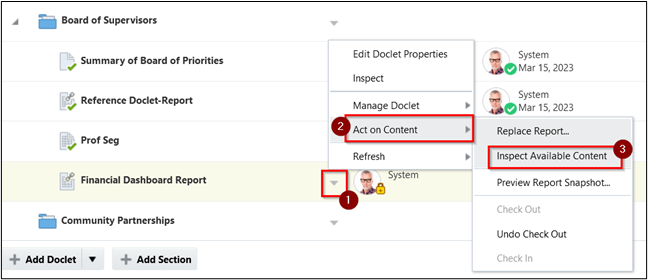
4. Click on the “ down arrow” which is next to the selected report.

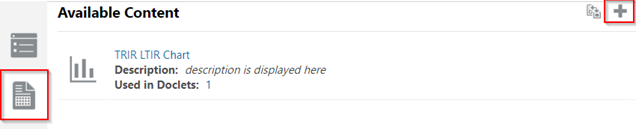
5. Click on “Act on Content” > Inspect Available Content


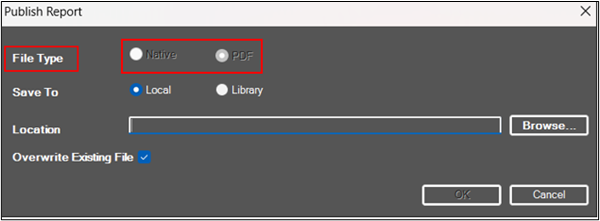
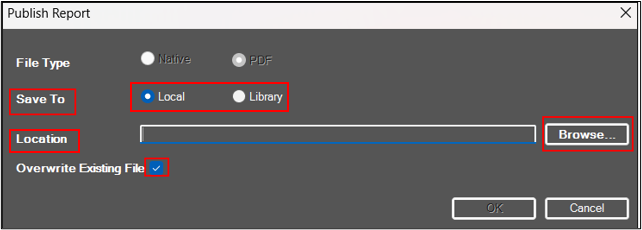
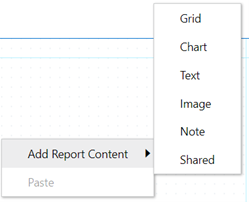
6. On the Available Content Screen, click on “+” to add.

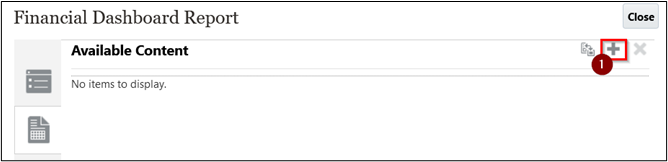
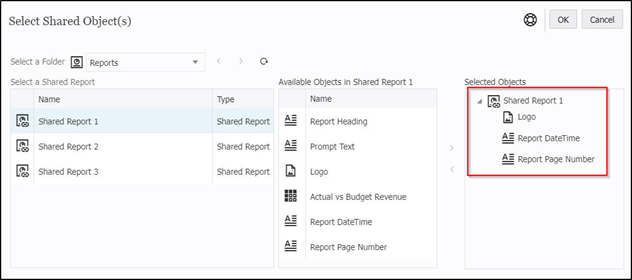
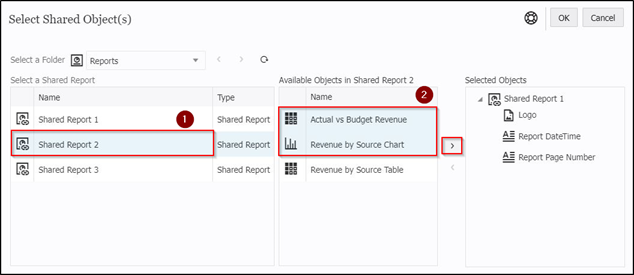
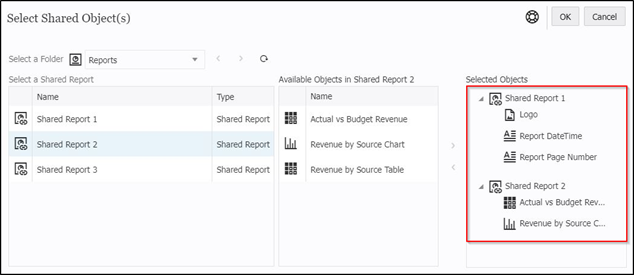
7. Add Report contents pop-up, to add Chart, Grid and Note.

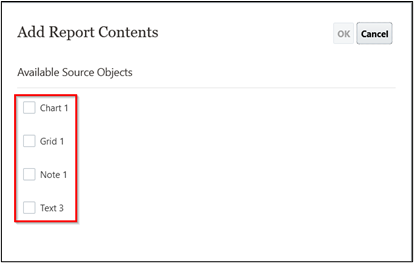
8. Check the box in front of Note 1, and enter the display name and description for it.
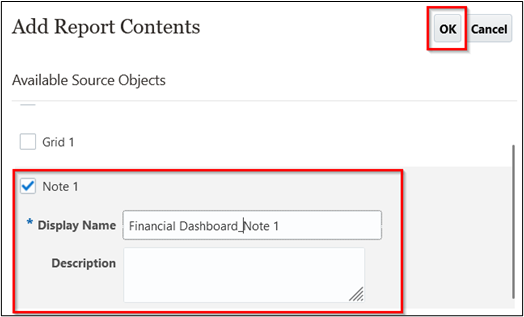
9. Click OK

10. Click on Close

11. Click on the “ down arrow” which is next to the selected report.

12. Click on “Act on Content” > Check In

Once the content is made available, now embed the note in the standard doclet:

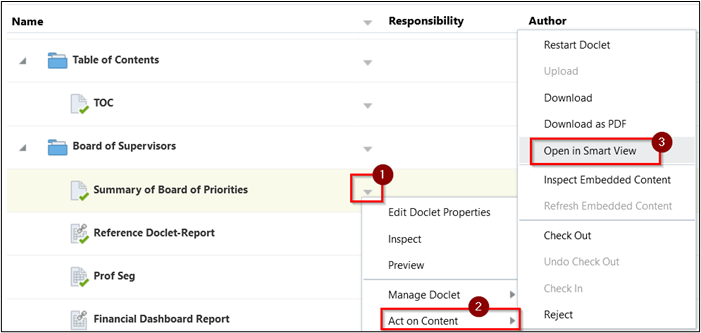
1. Select the doclet where you need to embed the note box.

2. Click on the “ down arrow” which is next to doclet.

3. Click on “Act on Content” > click on “Open in Smart View”.

4. Enter the login credentials.


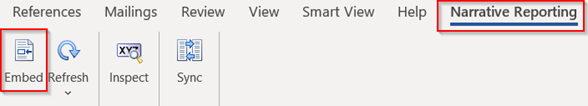
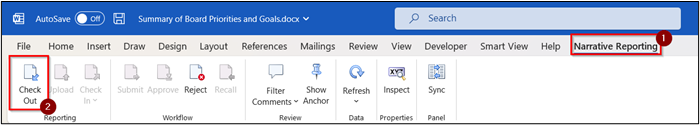
5. Go to the Narrative tab in MS-Word, click on Check Out
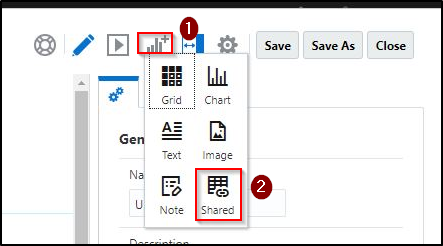
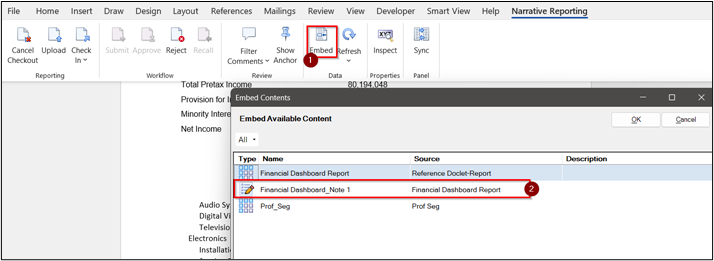
6. Click on Embed.

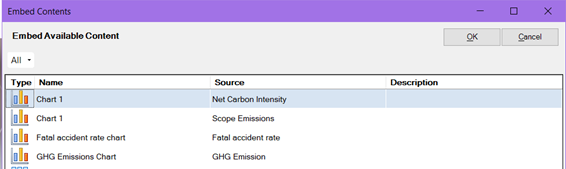
7. On the Embed Available Content pop-up, there will be a Financial Dashboard_Note 1 in the list which will be made available from the reference doclet.

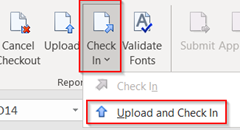
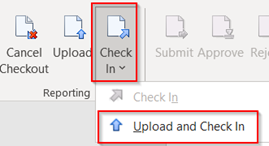
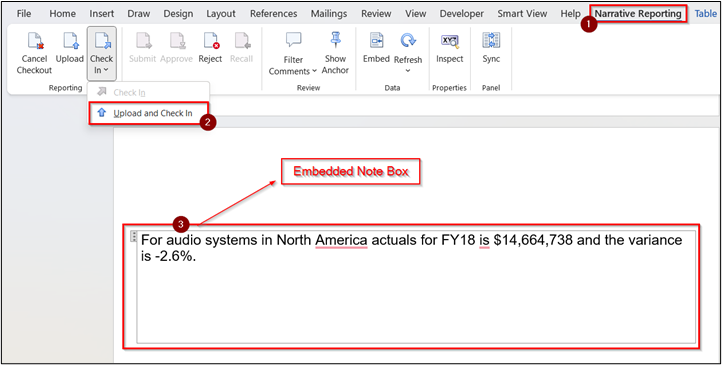
8. Click on Upload and Check In from the Check In drop-down. Preview the final version of the doclet that the note box is been embedded in the standard doclet.

Important considerations

There are quite a few considerations when inserting or removing reports-based content in a doclet. Oracle documentation covers it.

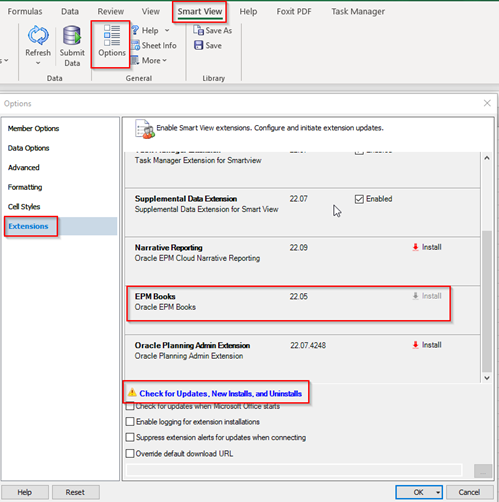
To use Smart View to embed Text or Note boxes in Regular doclets, install the 23.04 or later version of the Narrative Reporting extension for Smart View.

In conclusion, the reporting series on how to add notes and text boxes as available content has provided valuable insights and practical guidance for enhancing the presentation and organization of information.

We explored the importance of incorporating notes and text boxes to enrich the context, highlight key details, and improve communication.

Traditionally, to distribute budget/ACFR books (report packages) without providing access to the report package, Oracle EPM Narrative Reporting admins use the ‘Publish Report’ option in the Report Center.  Users also typically use the Report Center web interface to publish any formatting changes or embed content updates and changes made using the Smart View extension. These processes are tedious and inefficient, involving excessive back-and-forth between Smart View and the web interfaces.  To overcome this challenge, Oracle has introduced an option (in Oracle EPM Books version 23.02) to publish a report package directly from Smart View.

In this article, we’ll cover how to publish report packages, as well as sections and doclets from within report packages, directly from Smart View.

A report can be published as a PDF or in the report’s native format (e.g. Word or PowerPoint), and can be saved to the local drive or in the Narrative Reporting Library. The user may also overwrite an existing published report.

Note: To publish a report package, section, or doclet from Smart View, you will need to have installed Smart View version 23.100 or later.

Publishing a Report Package

  1. Connect to Narrative Reporting from the Smart View panel.
  2. From the Narrative Reporting Home, click “Library.”

Smart View

      3. Navigate to the desired report package.

    4. Click “Publish Report” on the Action Panel to publish the selected report package.

smart view

  5. In the dialog box, select either Native or PDF in the File Type

Note: If you are publishing a PDF report package, then the PDF option is selected by default.

smart view

  6. In the Save To field, select either Local or Library and click Browse to choose a location where the report should be saved.

Optional:  If you wish to overwrite an old version of the report that exists in this location, select the Overwrite Existing File check box.

smart view

  7. Click “OK” to publish the report package.

smart view

If published to the Library in its native format, the report appears in the selected folder under Library/Documents (System Folder) in the Smart View panel.

smart view


Publishing a Section or Doclet

  1. Connect to Narrative Reporting from the Smart View panel.
  2. From the Narrative Reporting Home, select Library.

smart view

  3. Navigate to the desired report package.

    4. To publish a specific section or doclet from the selected report package, click Open Report Package.

smart view

   5. Select the desired section or doclet and click Publish.

Note: The Publish action appears in the Action Panel only if the section or doclet has publishable content.

6. In the dialog box, choose your publishing options.

smart view

Oracle’s updated publishing options for EPM Narrative Reporting provide convenience and more streamlined workflows for publishing report packages, sections, or doclets directly from Smart View.

Contact us to learn more about Oracle EPM Cloud.

Creating Variables in Narrative Reporting:

What are Variables? 

Report package variables consolidate and maintain common text, numbers, and dates that are displayed throughout a report package. They can also be used to reference content between doclets. There are two types of variables which are static and reference variables. When a report package is carried over to the next year, the variables created will automatically update to show the current dates and information. This will ensure accuracy and consistency.

Let’s go through the differences between the two variable types, Static and Reference.

Static Variables:

  • A static variable is information defined by the user, such as dates or a set value, that is going to be used throughout the report package.
  • They can be easily updated, and all the doclets containing the variable value will be affected by the change.
  • Static variables are to help maintain common dates, numbers, and text across the report package.

Reference Variables:

  • Reference variables are created by referencing another doclet or file within the report package as the source. Ex: most reference doclets for variables will be an excel sheet.
  • Reference variables can be sourced from text in Word or an Excel cell value, but they cannot be sourced from PowerPoint.
  • Whenever the source document is updated or changed, those changes will automatically update the variable value wherever it is used in the report package.
  • This can be used for words such as ‘increase’ or ‘decrease’, or it can be used for numbers for data.

Let’s now create both a Static and a Reference variable.

How to Create a Static Variable:

  1. Open Microsoft Word and connect to your Narrative Reporting application through SmartView. To do this, go to the SmartView ribbon, click ‘Panel’, then Private Connections, then log into your instance.
  2. Find your report package and drill down to then find and open the doclet (likely a Word document) that you want to apply the variables to in your report package.
  3. Once your report package is open in the panel, click in the drop down, switch from ‘Report Center’ to ‘Variables’.

creating variables

    4. Click the green + sign to create a variable. Click Static Variable.

creative variable

   5. The Name is what you want it to be called. For example, say it is currently the year 2021, you can name it ‘Current Year’ and make the Value ‘2021’. (Description is optional). To save it, click the green check mark under where you are creating it.

creative variables

 6. Now, in your Word document, anywhere that you have 2021, the current year, highlight over 2021, then click the arrow in the properties panel to apply the variable.

creative variables

Your static variable is now complete!

Note: There are endless types of static variables. You can create other ones such as ‘Future Year’ – 2022, ‘Prior Year’ – 2021, Current Month, Prior Month, etc.

The purpose of these static variables is so now when 2022 becomes the ‘Current Year’ it is easy to switch that variable’s value, and it will replace all the values you had connected to it in your report package. This makes it easier rather than going through and changing them one by one.

How to Create a Reference Variable:

Tip: The easiest way to create a reference variable is to start by having a form in your Planning application already created, and contained with the data that you want to use.

  1. Open a blank excel sheet and connect it to your Planning application through SmartView (not your Narrative Reporting instance). Do this in the SmartView ribbon then select ‘Panel’ then ‘Shared Connections’.
  2. Drill down to find the form that you want to use to retrieve your data from.
  3. Click on the form. Click ‘Open form’ at the bottom. It will open in Excel.

creative variables


  4. It will open like the screenshot below, based on what the form looks like.

Note: These two screenshots in the example are not the same form.

creative reporting

 5. Save this excel sheet with a memorable name and close it. Go to your Narrative Reporting web instance and add this as a reference doclet in your report package. To do this, click the drop-down arrow of the section you are using the reference in, select ‘Manage Section’ then ‘Add Reference Doclet’.

creative reporting

  6. A screen will open where you can edit your reference doclet properties. Select the ‘Type’ as Excel, then browse for your excel sheet that you just created.

creative reporting

Tip: If you do not already have a subsection (or folder) within your section called “Reference Doclets” or “RD”, then create one.

Example of how to create a subsection is shown here:

creative reporting

 7. Now to reopen your excel sheet, go to your open Word document where you are putting the referenced variables. Make sure you are now connected to your Narrative Reporting instance through SmartView. In the Report Center, drill down to find the Excel sheet where you have saved it, then double click to open it.

 8. Once you have it opened in Microsoft Excel, create sheet 2 at the bottom. Create your own chart, like shown below, but to replicate your own data, to grab which numbers you need.

 9. Link your cells in sheet 2 to your data in sheet 1.

10. Example: B2 should have “=Sheet1!E3” (look above to see reference) and so on. The total in row 4 is the sum of rows 2 and 3. The totals in rows 7 and 8 are = to the totals in row 4.

creative reporting

 11. Open and check out the excel sheet (bottom right of your screen), then check it back in (top left in the Narrative Reporting ribbon).

creative variables creative variables


 12. Go back to your Word document, switch the drop-down where it says ‘Report Center’ to ‘Variables’.

13. Start creating all the reference variables that you need by clicking the green +.

14. Create a name for it. Description is optional. Notice how the third line is grayed out, this is for your value. To add the value, find the number in your Word document, highlight over it, then click the blue arrow. It will bring the value over.

15. Once you have a name and value, the checkmark will turn green. Click the green check mark.

For example, here are some of the reference variables created for this specific data.

16. Make sure to check out and then check back in your Word document. This is very important.

Your reference variable is now complete!

The purpose of these reference variables is to have the data in your report package linked to your planning application. This way, if the data was to change in the planning application, your report package will also reflect the change.

Contact us with any questions or for more information.

About AST 

AST is an award-winning, full-service enterprise solution provider, guiding digital transformation for clients in the Government and Commercial Sectors for more than two decades. Clients look to AST for leadership and assistance in transforming their organizations via software solutions, process engineering, and change management.


One of the greatest features of building a report package through Oracle’s narrative reporting is being able to embed content into a doclet. First, what is embedded content? Embedded content begins with building report objects. These can be a chart, grid, image, text, or note, and they are contained in a reference doclet. A reference doclet can be an Excel sheet, or it can be a report, which is built using the web interface. By using Oracle’s SmartView, doclet authors are able to embed content that can be published into a Word or PowerPoint based report package.

Let’s create a chart to embed into our report package.

Where do we begin? In your Narrative Reporting application, start by building a report object under Oracle’s ‘Reports’ icon.

native reporting

Once you create a new report, by clicking the + icon, a blank grid will open. By right-clicking anywhere in the blank report, you have the option to add report content. For this example, we will select a chart.

native reporting

When setting up the chart, it will require you to connect to a data source. Once that is complete, you can start creating the chart. There will be three options in the top left corner. To start putting in your own dimensions, go to the last one – ‘Source Grid’.

native reporting

native reporting


This icon is for the dimension layout. By clicking on the dimension layout icon, it enables you to drag, reorder, or remove dimensions in your Point-of-View.

Once your dimensions are in the POV that you want, start selecting the members that belong in each dimension. After that is complete, switch over to the ‘Chart Data’ tab, and select each row and column that you want to appear in your chart.

native reporting

Note: Any selected column or row will turn light blue, if it is not light blue, it will not appear in the chart.

You can now switch over to the first tab – ‘Chart Presentation’. Here is where you can make your chart unique. By going into the properties panel, under the General tab, you can choose your chart type.

native reporting

There are many other features you can edit which include: background color, grid lines, stacking, orientation, legend position and font, color, adding labels, etc.

Tip: Always create a unique name for your chart, or other report object, that way it will be easier to find later.

The ‘Chart Presentation’ tab shows you an example of what your chart will look like. To see what your chart looks like with your data and dimension members, select the preview icon in the top right corner.

native reporting


To switch back to edit mode, simply select the edit icon.

native reporting

Once you are happy with how your chart looks, make sure to click Save, then you are ready to embed it into the report package.

Let’s prepare the chart to be embedded into a report package.

Start by opening your report package in your Narrative Reporting application. Once you choose which section you want your chart to be in, click on the drop-down arrow of that section. Select ‘Manage Section’ then ‘Add Reference Doclet’.

narrative reporting

A screen will open where you can edit your reference doclet properties. Since we are embedding a chart from a report, select the Type as ‘Report’. Then ‘Browse’ to find the report that you want to embed.

narrative reporting

Note: The other reference doclet type is Excel – which is what you would select if you wanted to link an excel file. An example for this would be when using variables.

A confirmation to link the Report will come up. Always click yes. This is for if you want to make changes to your chart, or any report object, it will automatically update in your report package since it is linked.

narrative reporting

Note: The next screen to appear is Report POV. This is in case you have any variables, and you only want a piece of data, not the whole data. If you have none, which we do not in this example, simply click OK.

narrative reporting

Now, you will see it as a doclet in your report package. Click the drop-down arrow on your new reference doclet, click ‘Act on Content’, then ‘Check Out’.

narrative reporting

Note: When working within narrative reporting or reference doclets, we must always check it out to make changes, and then check it back in to save it.

Once it is checked out, click the drop-down arrow again, then ‘Act on Content’, then ‘Inspect Available Content’.

narrative reporting

This screen will appear, make sure it is on the second tab, then click the + icon to add your chart. Once you have selected it, it will appear like the example chart in the screenshot above.

To complete this step, you must check the doclet back in. To do this, click the drop-down again, ‘Act on Content’ then ‘Check In’.

Tip: If you plan on having multiple reference doclets within one section, it is always a good idea to create a subsection, or folder, within your section called ‘RD’ (or anything to your liking) to easily find them within your section.

Example of how to create a subsection is shown here:

narrative reporting

Let’s embed the chart into our report package using Word.

We are now ready to embed the chart into the Word doclet of the report package. Start by going to the SmartView ribbon in Word, click on Panel, then Private Connections. Connect your URL, and drill down until you find your report package.

Select the word doclet that you want to embed the chart in, and then click ‘Open and Check Out’ at the bottom of your SmartView panel. *Embedding will not be enabled if you do not check the doclet out first*

narrative reporting

Tip: Once you find where in the Word doclet you would like to add the chart, insert a textbox before embedding your chart, that way it is easy to move it around your report.

Once you have your textbox, go to the Narrative Reporting ribbon, and select ‘Embed’.

narrative reporting

All your available embedded contents will appear. Here is when creating a unique name for your chart comes in handy, that way it is easy to find.

narrative reporting

Once you have selected your embedded content, it is complete. You should be able to hover over it, and it will turn gray around the edges, that is how you know it was a success.

The last step, which is very important, is to check your doclet back in. Still in the Narrative Reporting ribbon, select the ‘Check In’ drop down, then ‘Upload and Check In’.

narrative reporting

Congratulations! You have now embedded a report object into a report package.

Tip: If you want to check that it worked and is now successfully in your report package, go back to your Narrative Reporting application. In the report center of your report package, click the Actions drop down menu. Click Refresh. It should now appear when you go to preview your report package.

narrative reporting

Contact us with any questions or for more information.

About AST 

AST is an award-winning, full-service enterprise solution provider, guiding digital transformation for clients in the Government and Commercial Sectors for more than two decades. Clients look to AST for leadership and assistance in transforming their organizations via software solutions, process engineering, and change management.


Oracle has introduced the shared reports and objects feature as EPM reports continue to move toward parity with legacy Financial Reporting.

When a report is designated as shared, all objects become shareable and can be inserted into other reports. These shared objects allow multiple reports to take advantage of standardized content without repeatedly recreating it. If the standardized content is modified in the shared report, the change is reflected across all “subscribing” reports.

A key benefit of the shared reports feature is that it facilitates standardization of boilerplate items that are frequently used so that all reports can have the same look and feel — for example: logos, headers, footers, etc.

How it works:

Create a report that contains the baseline shared objects

Here is a report that has been created with logos in the header and footer text. Items like these are beneficial in shared reports to maintain a consistent appearance. The report also has a grid and other text boxes.

shared reports and objects

To share the report:

  1. Go to “report designer
  2. Click “Save As”
  3. Check the box for “Save As Shared Report”

shared objects and reporting

shared objects and reporting

When the report is created, it is designated as a shared report in the library.

shared objects and reporting

All objects in the report can be shared (grids, charts, text boxes, images)

Embed shared objects into standard reports

Any report that uses a shared object is called a subscribing report.

In the subscribing report:

  1. Access the “shared report” and insert an “object
  2. The “shared object” will be placed at the same location you would find in the “shared report

Let’s use an example of an existing report that has been created. In this example, I want to maintain a standard look and feel in my header and footer, so I’m going to use some shared objects to do this.

  1. Open the “subscribing report” in “report designer
  2. Click on “Add icon” and click “Shared”

shared objects and reporting

  1. Select the folder of the “shared report
  2. Select the correct report
  3. Click on the “shared object” in the middle pane
  4. Move the object to the right

shared objects and reporting

Tip: It is useful to provide clear and friendly names to the shared report objects for help in selection.

shared objects and reporting

Note: Objects from different shared reports can be inserted into a single subscribing report.

shared objects and reporting

shared objects and reporting

7. There you have it: A linked report!

shared objects and reporting

8. Add “other report objects” to it and you are good to go!

Hovering the mouse over a shared object inserted in a report will display an “eye” icon to indicate a shared (non-editable) object. Clicking on that icon will provide additional information about the shared object, such as its source.

shared objects and reporting

shared objects and reporting

What else can be done with shared objects?

Modify the layout

Though the content of the shared object cannot be edited, you are free to change its original position or size in the subscribing report.

‘Unlink’ a subscribing report object from the shared report.

A shared object cannot be edited in the subscribing report. However, the object can be made independent of its source by unlinking it from the shared report.

A subscribing report can be inserted into a report package as an unlinked doclet or reference doclet. Once that happens, the shared objects will be unlinked from the source shared report.

Important considerations

There are quite a few considerations when using shared reports and objects. A few of them are listed below, while the Oracle documentation covers the complete list.

  • As of now, the shared reports feature is available only in Narrative Reporting deployments
  • A shared report cannot be used in Report Packages, Books, or Bursting Definitions
  • Once a report has been created as a shared report, it cannot be reverted to a regular report
  • An object in the subscribing report can’t have the same name as the shared object being used
  • Inserting a shared chart also inserts the underlying table data
  • When migrating shared reports from HFR, a report will be created for each shared object


Contact us with any questions or for more information.


About AST 

AST is an award-winning, full-service enterprise solution provider, guiding digital transformation for clients in the Government and Commercial Sectors for more than two decades. Clients look to AST for leadership and assistance in transforming their organizations via software solutions, process engineering, and change management.  


About Oracle 

Oracle (NYSE: ORCL) is a publicly traded multinational computer technology provider selling database software and technology, cloud-engineered systems, and enterprise software products. It offers integrated suites of applications plus secure, autonomous infrastructure in the Oracle Cloud.

Tagged with: , , ,

Building a report that shows the previous 12 months sounds simple enough, but it gets tricky when working with separate Year and Period dimensions. Can you build a report that shows datasets that bridge years, and can you make it dynamic? Do you need to build the logic in your application, or should you build this in a SmartView template in Excel? While different use cases require different solutions, in this article, we will cover a simple report design hack that addresses the most common requirements.

Out-of-the-Box Dimensionality in Oracle EPM

In most Oracle EPM implementations, out-of-the-box (OOB) capabilities and pre-built assets are enabled with separate dimensions for Year and Period. Separating these dimensions provides flexibility for modeling and analysis, most notably with planning/budgeting and consolidations.

Exceptions to this include:

i) FreeForm applications allow for custom-built models without the need for separate Year and Period dimensions. As the application is customized, there are a number of OOB features that cannot be enabled, including Predictive Planning.

ii) Financial Consolidation and Close (FCCS) now allows for the creation of a “virtual” single time dimension, which will simplify building views that cross years.

The application will still have separate Period and Year dimensions, but a new dimension called “SingleTime” can be leveraged in data forms and SmartView. (Note: Use of the SingleTime dimension is not supported in reporting – FR or MR – as of December 2022.)

Oracle EPM

The Challenge with Relative Functions Across Years

What about creating a TTM view when you must consider two time dimensions – Year and Period? For example, if a user selects Jul 2022, the report should show data from Aug 2021 through Jul 2022.

Oracle EPM

If the user selects Dec 2022, the report should show data from Jan 2022 through Dec 2022.

Oracle EPM

How do we build a report that knows when to display periods from 2021 and 2022, like in the example above, but is not hardcoded? Just like with other “trend” report types, these reports can be built using the RelativeMember function when combined with some advanced conditional suppression.

The Report Design “Hack”

There are essentially five components to the report design. We will walk through the selections with the first example we discussed, in which a user selects Jul 2022 and would like to see data from Aug 2021 through Jul 2022.

Oracle EPM

  1. The first column is set up to show data from the prior year in the case when the trailing periods overlap years (e.g. Aug 2021 to Dec 2021). The selection is Relative to Current Point of View for Years offset by -1.
  2. In the same column, we set up the Period selection to be a Range from Relative to Current Point of View for Period offset by 1 to Dec. So, when the user selects Jul, the column will show Aug to Dec.
  3. In the second column, we set up the Years dimension to show the Current Point of View for Years. This will show the dataset for 2022 in our example.
  4. For the Period dimension in the current year column, we select Range from Jan to Current Point of View for Period. This will show data from Jan to Jul.

Now we have the base data set, but what if the user selects Dec 2022, as in our second example? The report will show Jan to Dec 2021 in the first column (because the period offset of +1 from Dec in component 2 is Jan), and Jan to Dec 2022 in the second, which is incorrect.  

To address this, we need to add a column to help suppress the prior year’s data when the user selects Dec.

  1. This is a hidden column, and it is used as a condition in the advanced suppression setup for the first column. There are two steps here; the first is to set up this column as Hide Always, and the second is to set up Conditional Suppression logic to suppress the column if the period is Dec:

Oracle EPM

Then, for the first column, you will set up Conditional Suppression if the hidden column is suppressed:

Oracle EPM


You now have a dynamic trailing 12-month report! You can apply the same concepts for a trailing 6- or 18-month report, as well, to support rolling forecasts and other trend reports. In the example below, we’ve also added a sum so you can present a trailing 12-month total.

Oracle EPM

Contact us with any questions. Thanks for reading!

About AST 

AST is an award-winning, full-service enterprise solution provider, guiding digital transformation for clients in the Government and Commercial Sectors for more than two decades. Clients look to AST for leadership and assistance in transforming their organizations via software solutions, process engineering, and change management.  

About Oracle 

Oracle (NYSE: ORCL) is a publicly traded multinational computer technology provider selling database software and technology, cloud-engineered systems, and enterprise software products. It offers integrated suites of applications plus secure, autonomous infrastructure in the Oracle Cloud.


Tagged with: , , , ,

As of Smartview release 21.100, Oracle has introduced the ability to import EPM Cloud report books into Excel in a refreshable format for Financial Consolidation and Close, Narrative Reporting, Planning, and Tax Reporting*. This is available through a new Smartview extension called EPM Books.

*This feature is not currently supported for Financial Reporting (FR) reports and books, but these can be migrated to Reports to leverage this feature.

Getting Started

1) Download the EPM Books extensions from the Smart View Options menu under Extensions. Find the EPM Books extension and click Install.

EPM Books

2) After the installation is complete, launch EPM Books Home in the Smartview panel.

Note: EPM Books can be launched through either Shared or Private connections.

EPM Books

Running Books in Excel

3) When the EPM Books menu opens, click the Run button for the required report book, and a job will be kicked off.

Click the Refresh icon to update the job status.

Once the job completes, you can click the Download icon to open the book:

EPM Books

4) The report book will open with a table of contents. Reports in the book will open across separate tabs.

The worksheet names are based on the TOC headings you defined in the Properties panel in the Book Designer in the web application.

EPM Books

EPM Books

5) A new ribbon for Books will now be available where you can refresh book content and change the POV of the reports in the book.

Note: Excel currently does not support Member Selection in the Select POV dialog if a dimension Book POV option is set to allow all members. As a workaround, you can use a member selection function such as Descendants or SameGeneration to allow for flexible user selection.

EPM Books

Notes & Considerations:

  • Nested Books are not supported in Excel. For example, if there is a Book contained within a Book, the inner Book will be suppressed. The resulting Excel workbook will not contain the content related to the nested inner Book.
  • PDF and Word documents inserted as part of a Book are not supported. When a Book includes other documents of type PDF or Word, they will be omitted from the Excel workbook.
  • When connected to a non-Narrative Reporting data source, users will not be prompted to enter POV selections before importing the book to Excel, even when the Preview POV preference is enabled.
  • See the Oracle documentation for further details on EPM Books: https://docs.oracle.com/en/cloud/saas/enterprise-performance-management-common/svpbc/books.html

About AST 

AST is an award-winning, full-service enterprise solution provider, guiding digital transformation for clients in the Government and Commercial Sectors for more than two decades. Clients look to AST for leadership and assistance in transforming their organizations via software solutions, process engineering, and change management.  

About Oracle 

Oracle (NYSE: ORCL) is a publicly traded multinational computer technology provider selling database software and technology, cloud-engineered systems, and enterprise software products. It offers integrated suites of applications plus secure, autonomous infrastructure in the Oracle Cloud. 


In 2017, Andrew White from Gartner published a blog entitled: Before Implementing ERP Systems, Implement Application Data Management! It’s a quick and interesting read about how traditional MDM lacks the rigor to keep applications in sync beyond core elements like customer and product data.  The article makes many good points and coins the acronym ADM (Application Data Management), which influenced some major players, including Oracle & SAP.

His message was that traditional MDM doesn’t address the challenges of synchronizing application level data and settings across numerous ERP modules and other systems.  He observed that the slow degradation of data definitions and misalignment across applications rarely creates major issues quickly; it is more like death by a thousand cuts.  While his focus was on managing data across modules within an ERP, in the age of the Cloud these needs quickly transcend ERP, and need to include solutions provided by multiple vendors.

Enter Oracle’s Enterprise Data Management (EDM) Cloud, which has matured significantly in the in two years since its inception.  There are major benefits that can be achieved very quickly using the solution.  For example, financial reporting structures can be easily harmonized by merely installing and configuring out-of-the-box connectors to Oracle ERP Cloud Financials, as well as to Financial  Consolidation and Close and Planning in the Oracle EPM Cloud.

General Ledger reporting segments and hierarchies in ERP can be synchronized with reporting dimensions in Consolidation and Planning.  To the uninitiated, understanding the similarities and differences between these data structures can be daunting, and that was before they could be governed in a single tool!  Add in:

  • Robust security;
  • Drag and drop editing;
  • Approval workflows;
  • Automated updates across systems via a subscription model;
  • And the ability to audit metadata changes;

and the combination of insight and control that can be instituted in a matter of weeks is truly awesome and inspiring.

Applications

When applications are registered in Oracle EDM Cloud  using prebuilt adapters, metadata is generated automatically for all data elements to be mastered.  In the screenshot above, the applications that have been registered in EDM Cloud are shown.  The registration definitions include all the segment types, hierarchies, and reporting dimensions being mastered for those applications, as well as the connection details for those cloud services.

Viewing Application Dimensions & Metadata

When viewing an Application, all the nodes being mastered can be seen.  In the example above, the General Ledger (GL) Account Segments from the ERP Cloud Financials GL are viewed in list format.  The properties to the right include the account description, Boolean flags for allow budgeting/posting/etc., effective dates, and other metadata required by the General Ledger in Oracle ERP Cloud.

Maintenance Centric Views

While it’s useful to see all the metadata being mastered for an application, where EDM Cloud really shines is when domain-specific views are created.  In the example above, a custom view shows all the uses of GL Accounts across these applications.  The first tab shows the GL Account structure as a hierarchy, rather than a list view.  The properties for each account remain the same, the definitions required by the Oracle Fusion GL.

The second tab in the Account Maintenance View shows the Accounts dimension in Financial Consolidation and Close.  The same Account that was highlighted on the prior tab is highlighted here, and at a glance one can quickly tell that the Financial Consolidation and Close Account dimension looks significantly different from the Fusion GL Account hierarchy.  It contains many prebuilt members, but all the leaf level GL segments are required, and many of the parent members are reused as well!  The properties being managed are also quite different, and reflect the metadata used to manage and tune the performance of the Financial Consolidation and Close in the EPM Cloud  application.

The third tab in the view displays the Planning Account dimension.  It is purpose-built to support multiple planning models and contains many prebuilt members.  It also has the most complex property metadata, since the dimension can be tuned differently for use in the Financial, WorkForce, Project, CAPEX, Strategic, and Custom planning models within Oracle EPM Cloud.

Managing all these aspects centrally within EDM Cloud  allows multiple teams to collaborate and effectively control the impacts of GL segment changes across the enterprise.  The use case we’ve shared can be extended well beyond GL segment changes to include classification schemes, status codes and system settings.  It can also include Data Warehouse reporting dimensions to keep the mappings used by the ETL process up-to-date.  The ability to comprehensively validate metadata enables organizations to proactively control the impact of application-level changes across the enterprise, providing reporting landscapes like never before.

Contact AST today to learn more about EDM Cloud, and how Application Data Management can benefit your organization.

The EPM Automate utility can now be used on Mac.  In this post, you will learn how to install the utility on Mac OS and get it working.  Let’s dive right in!

Download and Install JDK

The first step is to download Java Development Kit (JDK) from Oracle’s website.  If you already have JDK installed, you may skip to the next step.  

Accept the license agreement and select the .dmg file for Mac OS.

Once the download is complete, proceed with installing JDK on your Mac.  After installation, open a new terminal and type the following commands to ensure that Java has been properly installed.

The first command will give you the path to where Java has been installed (usually “/usr/bin/java”).  The second command will provide version details of the Java installed on your Mac.

Download EPM Automate for Mac OS

Log in to the EPM instance and navigate to Downloads.  

Select the “Download for Linux/Mac” option for EPM Automate.

This will download the EPMAutomate.tar file.  I then moved the file to a “Documents/EPM” folder.  

The next step is to unzip the “.tar” file, which can be done by following these commands on your Mac Terminal:

The above commands will create the epmautomate folder within the “/Documents/EPM” folder.

Set JAVA HOME and Path to EPM Automate

For the EPM Automate utility to work properly, we need to set up JAVA_HOME and the path to the EPM Automate utility.  Begin by opening the .bash_profile.

Once open, add the following details to the end of the file.  (Press “Esc + i” to edit the file.)

Important Note:  Be sure to provide the correct path to the EPM Automate bin directory.

Save the file by pressing “esc” and “wq!”, then “Enter/Return”.  Exit the terminal.  Open a new terminal and type the following to ensure all is working properly:

You should see a screen like this, in which you can see that the path to Java and the Path to EPM Automate are correctly set.

Run EPM Automate Commands

Open a terminal and type epmautomate.sh to receive this output:

Now, you can use the EPM Automate utility on your Mac!

As always, let us know if you have questions by leaving a comment below.  Thanks for stopping by!

Tagged with: , , , , , ,

In this post, we’ll cover the basics of using PBCS/EPBCS REST APIs using Groovy Scripts.

With the release of the REST APIs, you now have the ability to develop robust applications using Java, Groovy, and CURL.  Let’s see how we can use PBCS REST APIs.  

For the purposes of this post, it is assumed that you are using a Windows Operating System, though Groovy can also be installed on Mac/Linux.

Here is a summary of the topics we’ll cover in this post:

  • Install and Configure Java
  • Install and Configure Groovy
  • Groovy Console
  • The First Groovy Program

Install and Configure Java

The first step is to install Java on your system. Head over to Oracle to get the latest version of Java SDK. Accept the license agreement and download the software. Once the software is download, install Java on your system, keeping the default options.

In my case, I downloaded the 64-bit version, as shown below.

 Once Java is installed, make sure to:

  1. Add JAVA_HOME to Environment Variables and
  2. Edit your “Path” environment variable to include the path to the Java folder.

For further explanation on how to complete the above two configurations, click here. Be sure to restart your system after making changes to the environment variables.

Once logged back in, open command prompt and type “java -version” and you should see the version displayed, as shown below.

Install and Configure Groovy

The second step in this process is to install Groovy. Head over to the Groovy Language website, scroll down, and download the “Windows Installer“, keeping all default values.

Next, download the java-json.jar file. Head over to the Java2s website to download the file. Copy the java-json.jar file to the Groovy Library folder.

In my case, it is “C:\Program Files (x86)\Groovy\Groovy-3.0.0\lib”.

Now, you’re all set to start invoking PBCS REST APIs using Groovy!

The Groovy Console

Open the Groovy console from the Windows start menu. The console consists of 3 main areas:

  • Toolbar
  • Editor – Write the code here
  • Output Area – Check error messages and output messages here

You should also become familiar with the “Execute” and “Clear” buttons, as shown in the image below.

The First Groovy Program

Oracle has provided some excellent examples and sample code for using PBCS REST APIs using Groovy. Head over to Oracle Docs for details. We’ll be working with the “List Files” function. Before we start, though, let’s look at the anatomy of a groovy script.

Import Section

The import section consists of any external files (libraries) that are needed to execute the program. In our example, we’ll include the following:

import org.json.JSONObject
import groovy.json.JsonSlurper

Variables

Assuming you are already familiar with variables, allow me to dive right in and explain the variables we’ll be using:

  • serverUrl:  Stores the planning URL. Be sure to include the port number at the end.
  • username:  PBCS/EPBCS login user name. The format to be followed is “domain.username”.
  • password:  PBCS/EPBCS login password.
  • apiVersion:  default to V3.
  • appName:  PBCS/EPBCS Application name.

Below is the sample code. To find the current version of Migration APIs, click here.

serverUrl="https://planning-yoururl.oraclecloud.com:443" username="a123456.adminuser"
password="mypassword"
apiVersion="11.1.2.3.600"
appName="Vision"

Methods or Functions

We’ll re-use the functions and methods from Oracle’s documentation. Grab the code for the following:

  • fetchResponse ( )
  • fetchJobStatusFromResponse ( )
  • executeRequest ( )
  • listFiles ( )

You’re all set!

Now for the fun part – seeing the results. Before we go ahead and execute the code, let’s add the following line to invoke the process:

listFiles();

Click the “Execute” button and take a moment to enjoy the first Groovy Script.

As always, don’t hesitate to leave us a comment below with any questions.  Thanks for stopping by!

*You might also want to check out an earlier post, Testing PBCS REST APIs Using SoapUI.

Tagged with: , , , , , , , ,