
Creating & Embedding Report Objects with Narrative Reporting

One of the greatest features of building a report package through Oracle’s narrative reporting is being able to embed content into a doclet. First, what is embedded content? Embedded content begins with building report objects. These can be a chart, grid, image, text, or note, and they are contained in a reference doclet. A reference doclet can be an Excel sheet, or it can be a report, which is built using the web interface. By using Oracle’s SmartView, doclet authors are able to embed content that can be published into a Word or PowerPoint based report package.
Let’s create a chart to embed into our report package.
Where do we begin? In your Narrative Reporting application, start by building a report object under Oracle’s ‘Reports’ icon.

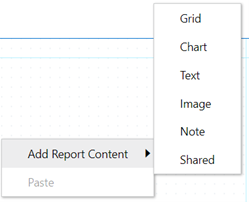
Once you create a new report, by clicking the + icon, a blank grid will open. By right-clicking anywhere in the blank report, you have the option to add report content. For this example, we will select a chart.
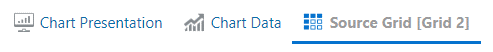
When setting up the chart, it will require you to connect to a data source. Once that is complete, you can start creating the chart. There will be three options in the top left corner. To start putting in your own dimensions, go to the last one – ‘Source Grid’.
![]()
This icon is for the dimension layout. By clicking on the dimension layout icon, it enables you to drag, reorder, or remove dimensions in your Point-of-View.
Once your dimensions are in the POV that you want, start selecting the members that belong in each dimension. After that is complete, switch over to the ‘Chart Data’ tab, and select each row and column that you want to appear in your chart.
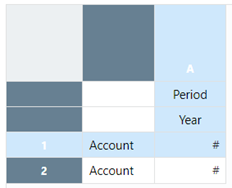
Note: Any selected column or row will turn light blue, if it is not light blue, it will not appear in the chart.
You can now switch over to the first tab – ‘Chart Presentation’. Here is where you can make your chart unique. By going into the properties panel, under the General tab, you can choose your chart type.
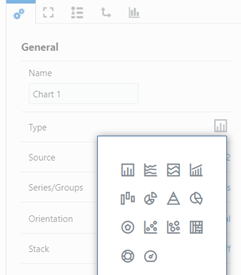
There are many other features you can edit which include: background color, grid lines, stacking, orientation, legend position and font, color, adding labels, etc.
Tip: Always create a unique name for your chart, or other report object, that way it will be easier to find later.
The ‘Chart Presentation’ tab shows you an example of what your chart will look like. To see what your chart looks like with your data and dimension members, select the preview icon in the top right corner.
![]()
To switch back to edit mode, simply select the edit icon.
![]()
Once you are happy with how your chart looks, make sure to click Save, then you are ready to embed it into the report package.
Let’s prepare the chart to be embedded into a report package.
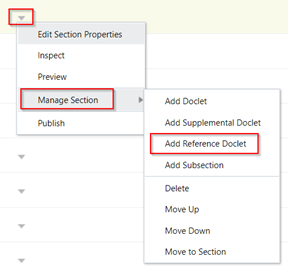
Start by opening your report package in your Narrative Reporting application. Once you choose which section you want your chart to be in, click on the drop-down arrow of that section. Select ‘Manage Section’ then ‘Add Reference Doclet’.
A screen will open where you can edit your reference doclet properties. Since we are embedding a chart from a report, select the Type as ‘Report’. Then ‘Browse’ to find the report that you want to embed.
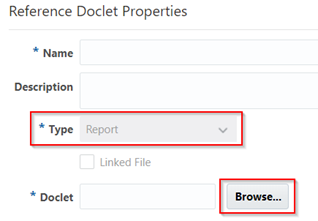
Note: The other reference doclet type is Excel – which is what you would select if you wanted to link an excel file. An example for this would be when using variables.
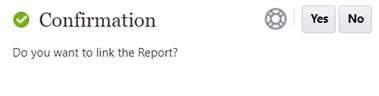
A confirmation to link the Report will come up. Always click yes. This is for if you want to make changes to your chart, or any report object, it will automatically update in your report package since it is linked.
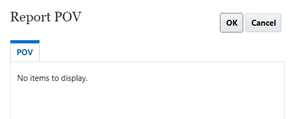
Note: The next screen to appear is Report POV. This is in case you have any variables, and you only want a piece of data, not the whole data. If you have none, which we do not in this example, simply click OK.
Now, you will see it as a doclet in your report package. Click the drop-down arrow on your new reference doclet, click ‘Act on Content’, then ‘Check Out’.
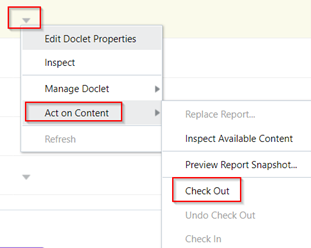
Note: When working within narrative reporting or reference doclets, we must always check it out to make changes, and then check it back in to save it.
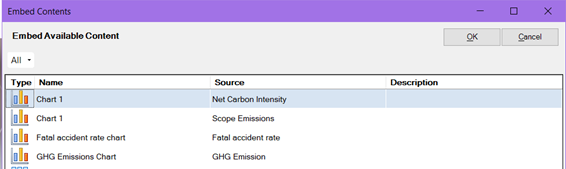
Once it is checked out, click the drop-down arrow again, then ‘Act on Content’, then ‘Inspect Available Content’.
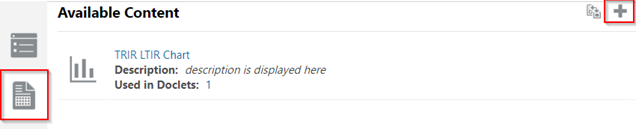
This screen will appear, make sure it is on the second tab, then click the + icon to add your chart. Once you have selected it, it will appear like the example chart in the screenshot above.
To complete this step, you must check the doclet back in. To do this, click the drop-down again, ‘Act on Content’ then ‘Check In’.
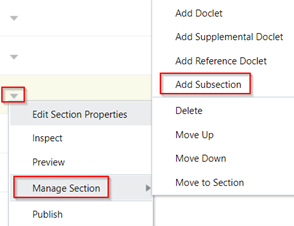
Tip: If you plan on having multiple reference doclets within one section, it is always a good idea to create a subsection, or folder, within your section called ‘RD’ (or anything to your liking) to easily find them within your section.
Example of how to create a subsection is shown here:
Let’s embed the chart into our report package using Word.
We are now ready to embed the chart into the Word doclet of the report package. Start by going to the SmartView ribbon in Word, click on Panel, then Private Connections. Connect your URL, and drill down until you find your report package.
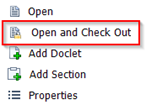
Select the word doclet that you want to embed the chart in, and then click ‘Open and Check Out’ at the bottom of your SmartView panel. *Embedding will not be enabled if you do not check the doclet out first*
Tip: Once you find where in the Word doclet you would like to add the chart, insert a textbox before embedding your chart, that way it is easy to move it around your report.
Once you have your textbox, go to the Narrative Reporting ribbon, and select ‘Embed’.
All your available embedded contents will appear. Here is when creating a unique name for your chart comes in handy, that way it is easy to find.
Once you have selected your embedded content, it is complete. You should be able to hover over it, and it will turn gray around the edges, that is how you know it was a success.
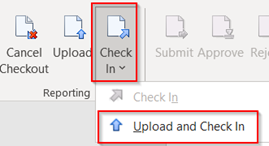
The last step, which is very important, is to check your doclet back in. Still in the Narrative Reporting ribbon, select the ‘Check In’ drop down, then ‘Upload and Check In’.
Congratulations! You have now embedded a report object into a report package.
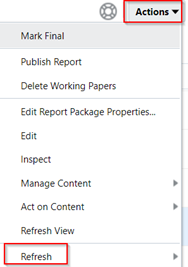
Tip: If you want to check that it worked and is now successfully in your report package, go back to your Narrative Reporting application. In the report center of your report package, click the Actions drop down menu. Click Refresh. It should now appear when you go to preview your report package.
Contact us with any questions or for more information.
About AST
AST is an award-winning, full-service enterprise solution provider, guiding digital transformation for clients in the Government and Commercial Sectors for more than two decades. Clients look to AST for leadership and assistance in transforming their organizations via software solutions, process engineering, and change management.
Leave a Reply